In an increasingly digitized industrial environment, having data is not enough. The real competitive advantage lies in... transform that data into clear, actionable, and real-time information.
In Téciman Digital we develop custom interactive dashboardsdesigned to fully adapt to each organization, without recurring licenses and with total integration into existing systems.
You can see it live at BIEMH 2026, get your ticket by doing Click here
What is a dashboard and why is it key in the industry?
A dashboard is a visual tool that allows you to monitor a company's main indicators (KPIs) from a single environment.
Its function is:
- Centralize information from different sources
- Visualize processes in real time
- Detect deviations automatically
- Facilitate data-driven decision-making
It's not just about showing graphs, but about turning complex data into useful knowledge for quality, production, engineering, finance or management managers.
Dashboards by functional areas
Production
It allows real-time monitoring:
- Line and machine status
- OEE and productive performance
- Stops and unproductive time
- Predictive maintenance analysis
All from a single centralized panel.
Quality
Designed for departments that require exhaustive control and traceability:
- Tracking deviations by Manufacturing Order
- Defect and non-conformity analysis
- Production failure prediction
- Dimensional control connected to measurement systems
- Intelligent alarm generation
It facilitates continuous improvement and the reduction of non-quality costs.
Finance
It provides a clear view of the company's financial status:
- Real-time P&L
- Income and expense control
- Treasury situation
- Financial projections
- Identification of budget deviations
Commercial
It allows you to analyze:
- Lead conversion and sales
- Customer segmentation
- Evolution of business objectives
- Market trends
With data that is always up-to-date and connected to CRM or ERP.
Human Resources
It includes indicators such as:
- Absenteeism
- Impact of hours per project
- Overtime and shifts
- Work climate assessment through data analysis
What differentiates Téciman Digital's dashboards?
Unlike standard solutions or closed software, our developments offer:
- One-time payment (no recurring licenses)
- 100% customization
- Integration with any data source (ERP, measurement systems, production, finance…)
- Scalability and connectivity with AI and virtual agents
We don't impose a closed tool: we design the system based on the real needs of each company.
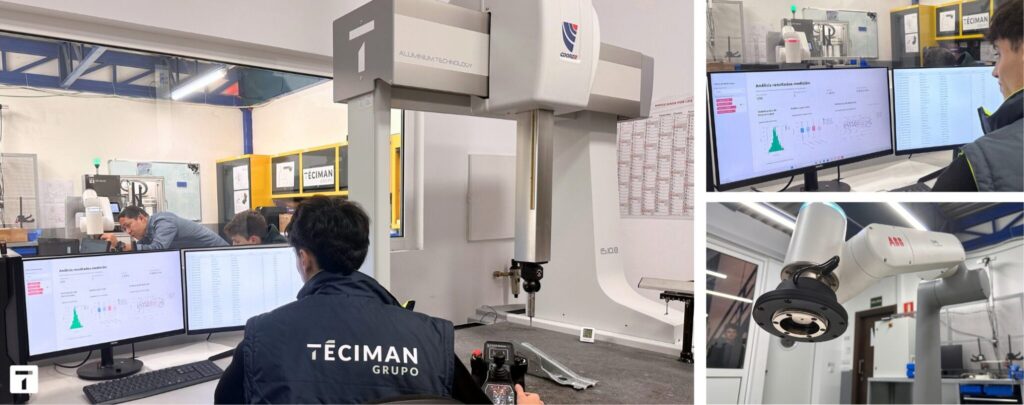
Control panel connected to dimensional control at BIEMH
At the BIEMH (Biennial of Machine Tools) trade fair, we presented a real-world example of integration:
A control panel connected to a dimensional control system consisting of:
- Three-dimensional measuring machine
- Robot for automatic loading of parts
This system allows:
- Visualize the process instantly
- Control quality and production from a single panel
- Detect deviations automatically
- Generate smart alarms
- Analyze trends in real time
- Check the status of the process using a virtual agent
A practical demonstration of how data management can be directly integrated into the production environment.
If you also want to view all your data easily and efficiently, call us on 947 20 91 41 or send us an email to teciman@teciman.com. Follow us on LinkedIn to find out all the news.